Due dates, status, progress and deliverables for every milestone.
Milestones that tell you what is actually happening
Live milestone data gives a clearer view than a weekly status report. Vaizy gives portfolio leads an interactive timeline with delivery phases, resource allocation, and risk signals built in, updated as work happens.
CodeMilestoneProjectDueStatusTeamProgressNet impact
MS-6Deployment & LaunchProduction deployment, monitoring setup, and go-liveSWSample Website Project22 JanPending

 0%+€13,000
MS-5App Store LaunchPrepare release assets, compliance, and launch supportSMSample Mobile App Project23 DecPending0%+€28,000
0%+€28,000MS-4Campaign LaunchGo live across paid, social, and email channelsSPSample Product Launch Campaign23 DecPending
 0%+€11,000
MS-5Performance ReviewAnalyze campaign performance and report on resultsSPSample Product Launch Campaign20 JanPending0%+€11,500
0%+€11,500MS-5Testing & QAUnit, integration, and user acceptance testsSWSample Website Project7 JanPending0%-
0%-MS-4Beta TestingRun device matrix testing and collect feedbackSMSample Mobile App Project26 NovIn Progress35%-
35%-MS-4Backend & API DevelopmentREST APIs, database schema, and authenticationSWSample Website Project21 DecIn Progress40%+€12,000
40%+€12,000MS-3Frontend DevelopmentBuild the responsive pages and component librarySWSample Website Project11 DecIn Progress55%+€15,000
55%+€15,000MS-3iOS & Android BuildNative builds for iOS and Android from one codebaseSMSample Mobile App Project2 NovIn Progress80%+€22,000
80%+€22,000MS-2Design & WireframingWireframes, visual design, and design systemSWSample Website Project10 NovIn Progress70%+€8,000
70%+€8,000MS-2UX & PrototypeUser flows and clickable prototype for testingSMSample Mobile App Project3 OctIn Progress90%-
90%-MS-1Project Kickoff & RequirementsKickoff, stakeholder interviews, and requirementsSWSample Website Project20 OctCompleted100%-
100%-Control delivery, not slide decks
When milestone status, financial context, and risk notes live in separate tools, portfolio oversight breaks down. Vaizy keeps those signals connected so teams can steer from reality instead of stitched-together reports.
Capabilities
What you get
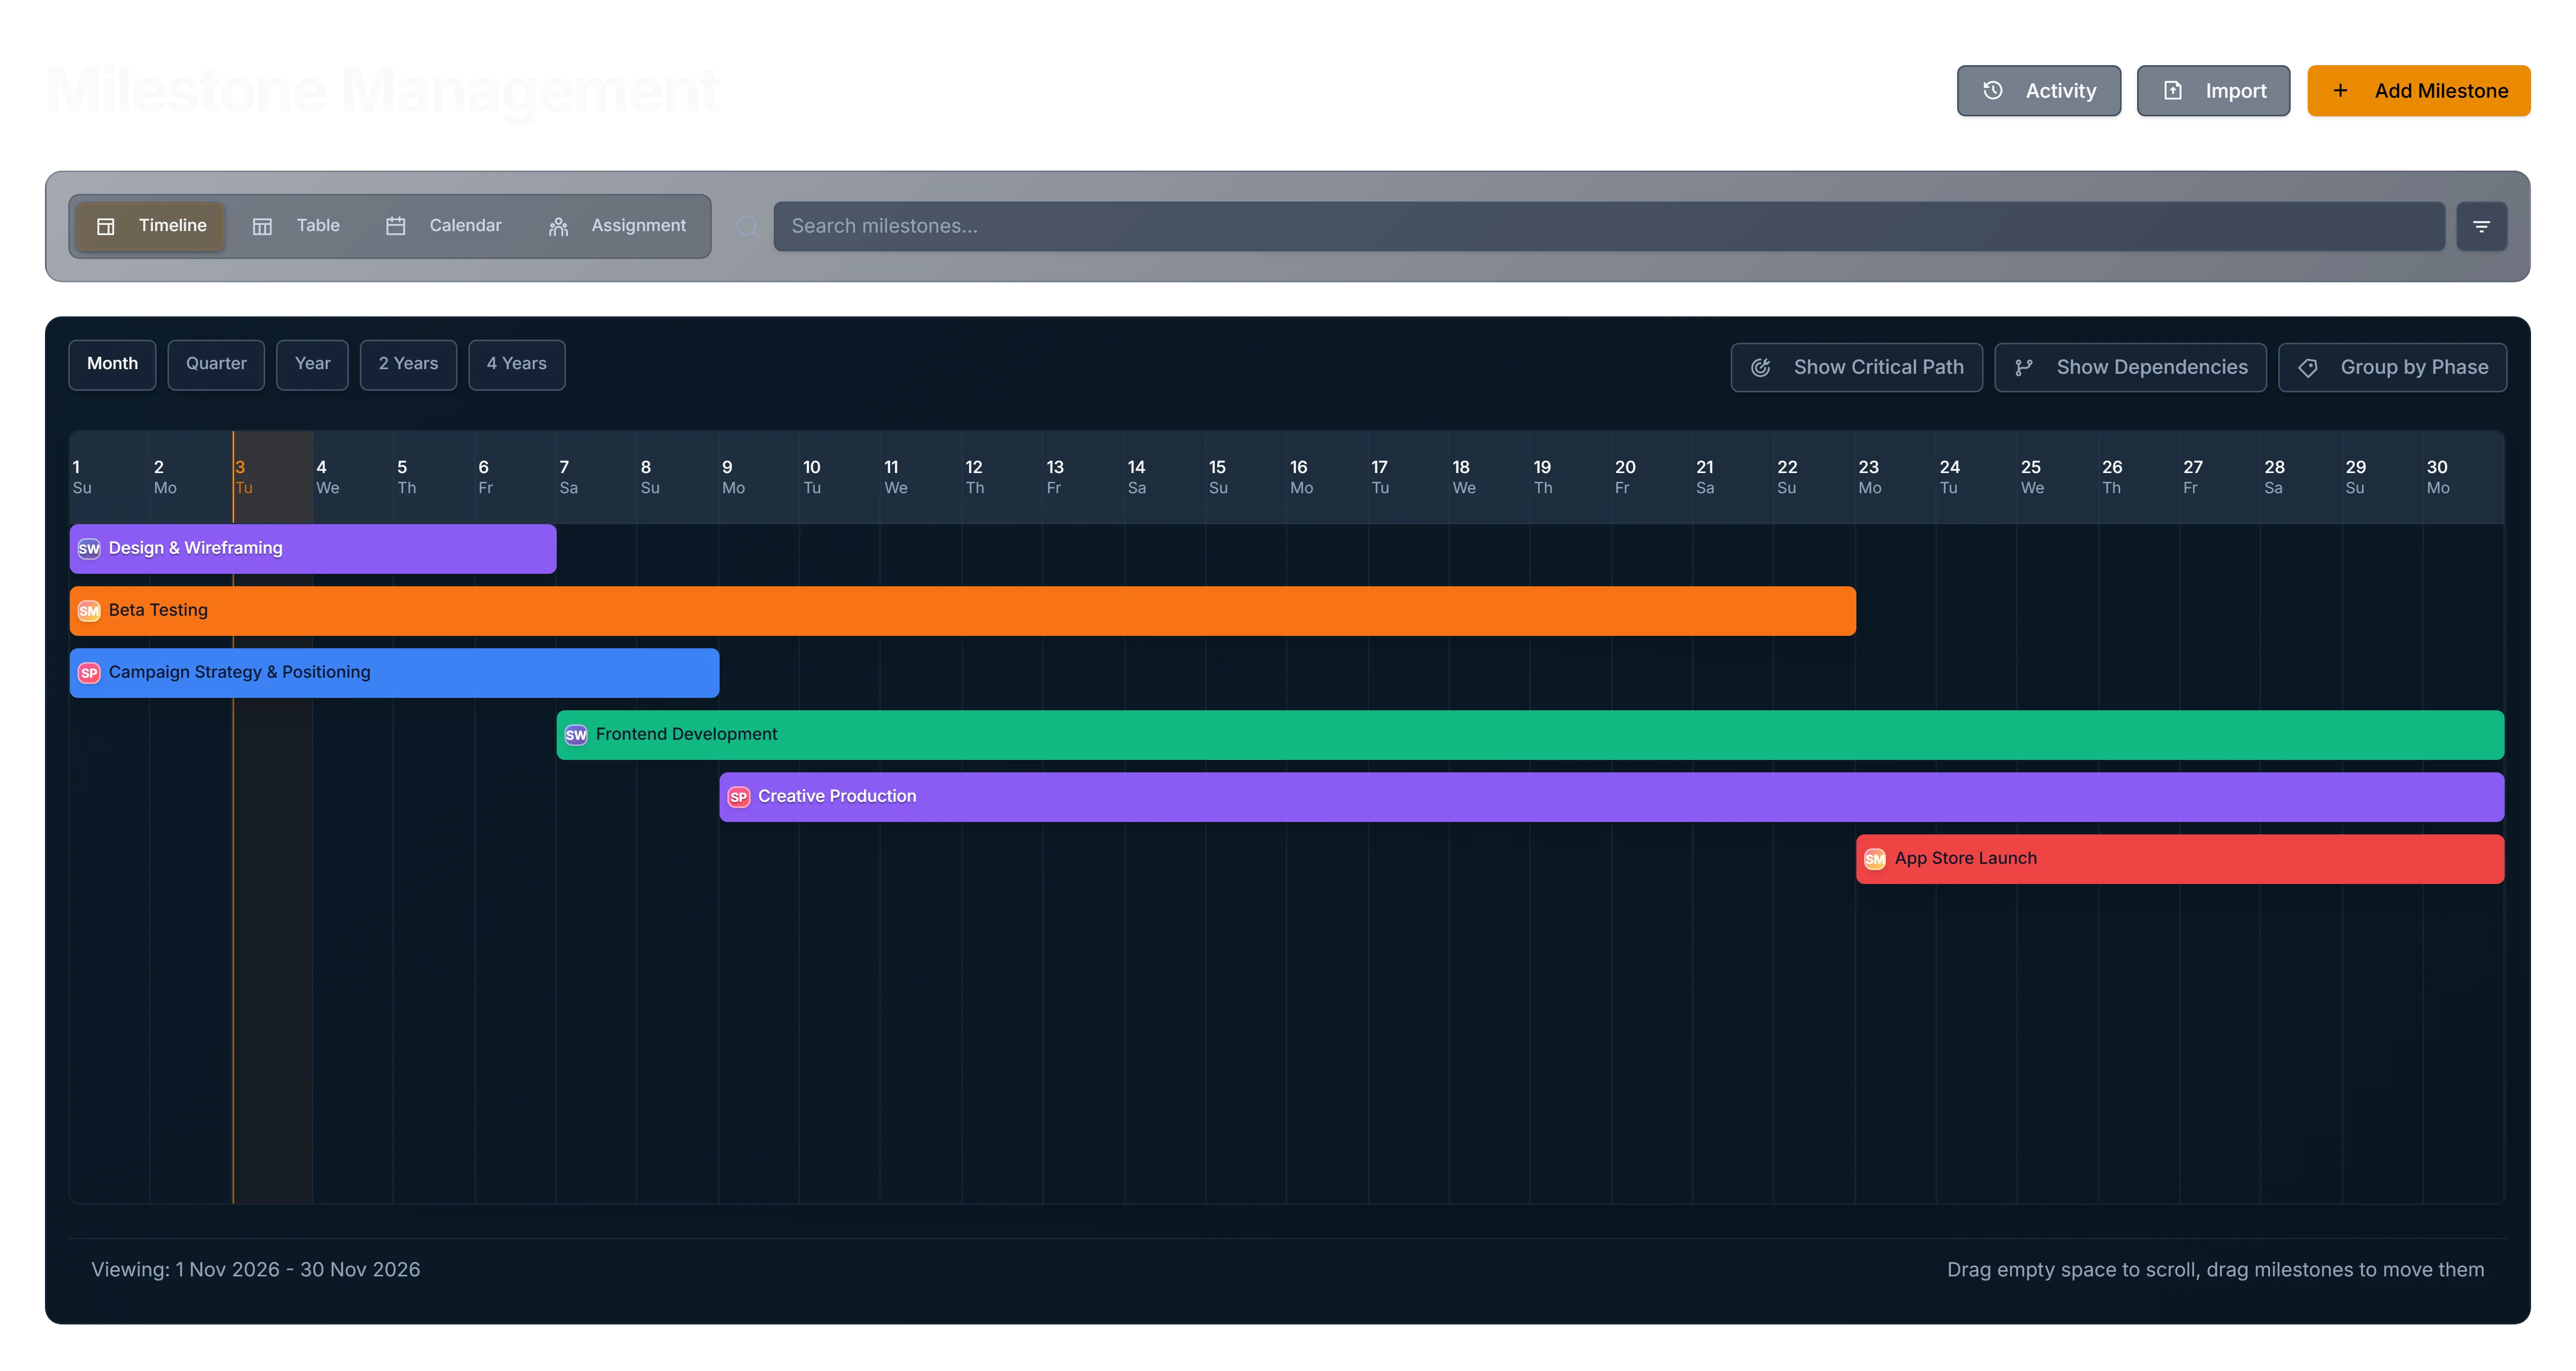
Interactive timeline
Drag milestones, adjust deadlines, and visualize delivery phases across the portfolio. Changes propagate to linked risks and budget records automatically.
Track every milestone across active projects from a single interactive timeline.
Project dependencies and critical path
Link projects finish-to-start, start-to-start, finish-to-finish, or start-to-finish, with lag. The roadmap draws the connectors, highlights the critical path, and shows how a slipping project pushes the ones that depend on it.
Link delivery status to budget context and risk signals, not separate spreadsheets.
Plan revisions
Vaizy keeps an "Original plan" and a "Final (as delivered)" snapshot automatically, and you can save named revisions at any point. Compare any two, or a revision against today, side by side with charts. Available on Pro and Enterprise.
Reduce manual status reporting by keeping portfolio information live and current.
Statuses that match reality
Put a milestone On Hold to pause it without it going overdue, or mark it Cancelled to take it out of the plan: no reminders, no future team costs, and no longer counted in progress or earned value, while money already spent stays as actual cost.
Link projects with dependencies and see the critical path, so you know which slip moves the end date.
Resource allocation matrix
See which team members are assigned to which milestones, and where the same people are stretched across competing deliverables.
Save your plan as a revision and compare it against today to see exactly what changed since the baseline.
Board and table workflows
Switch between timeline, Kanban board, and table views depending on what the team needs. All views share the same data.
How it works
Create a project from scratch or a reusable template with milestone structures.
Track delivery through timeline, board, or table, with linked risks and budget attached.
Review the portfolio in real time and steer meetings toward exceptions, not status recaps.
Replace the weekly status report
Portfolio leads deserve live delivery data, not slides that were accurate two days ago. Vaizy keeps milestone context current so meetings focus on decisions.
Prefer a spreadsheet for now?
Start with a free template. It imports into Vaizy when you are ready.